Oman
|
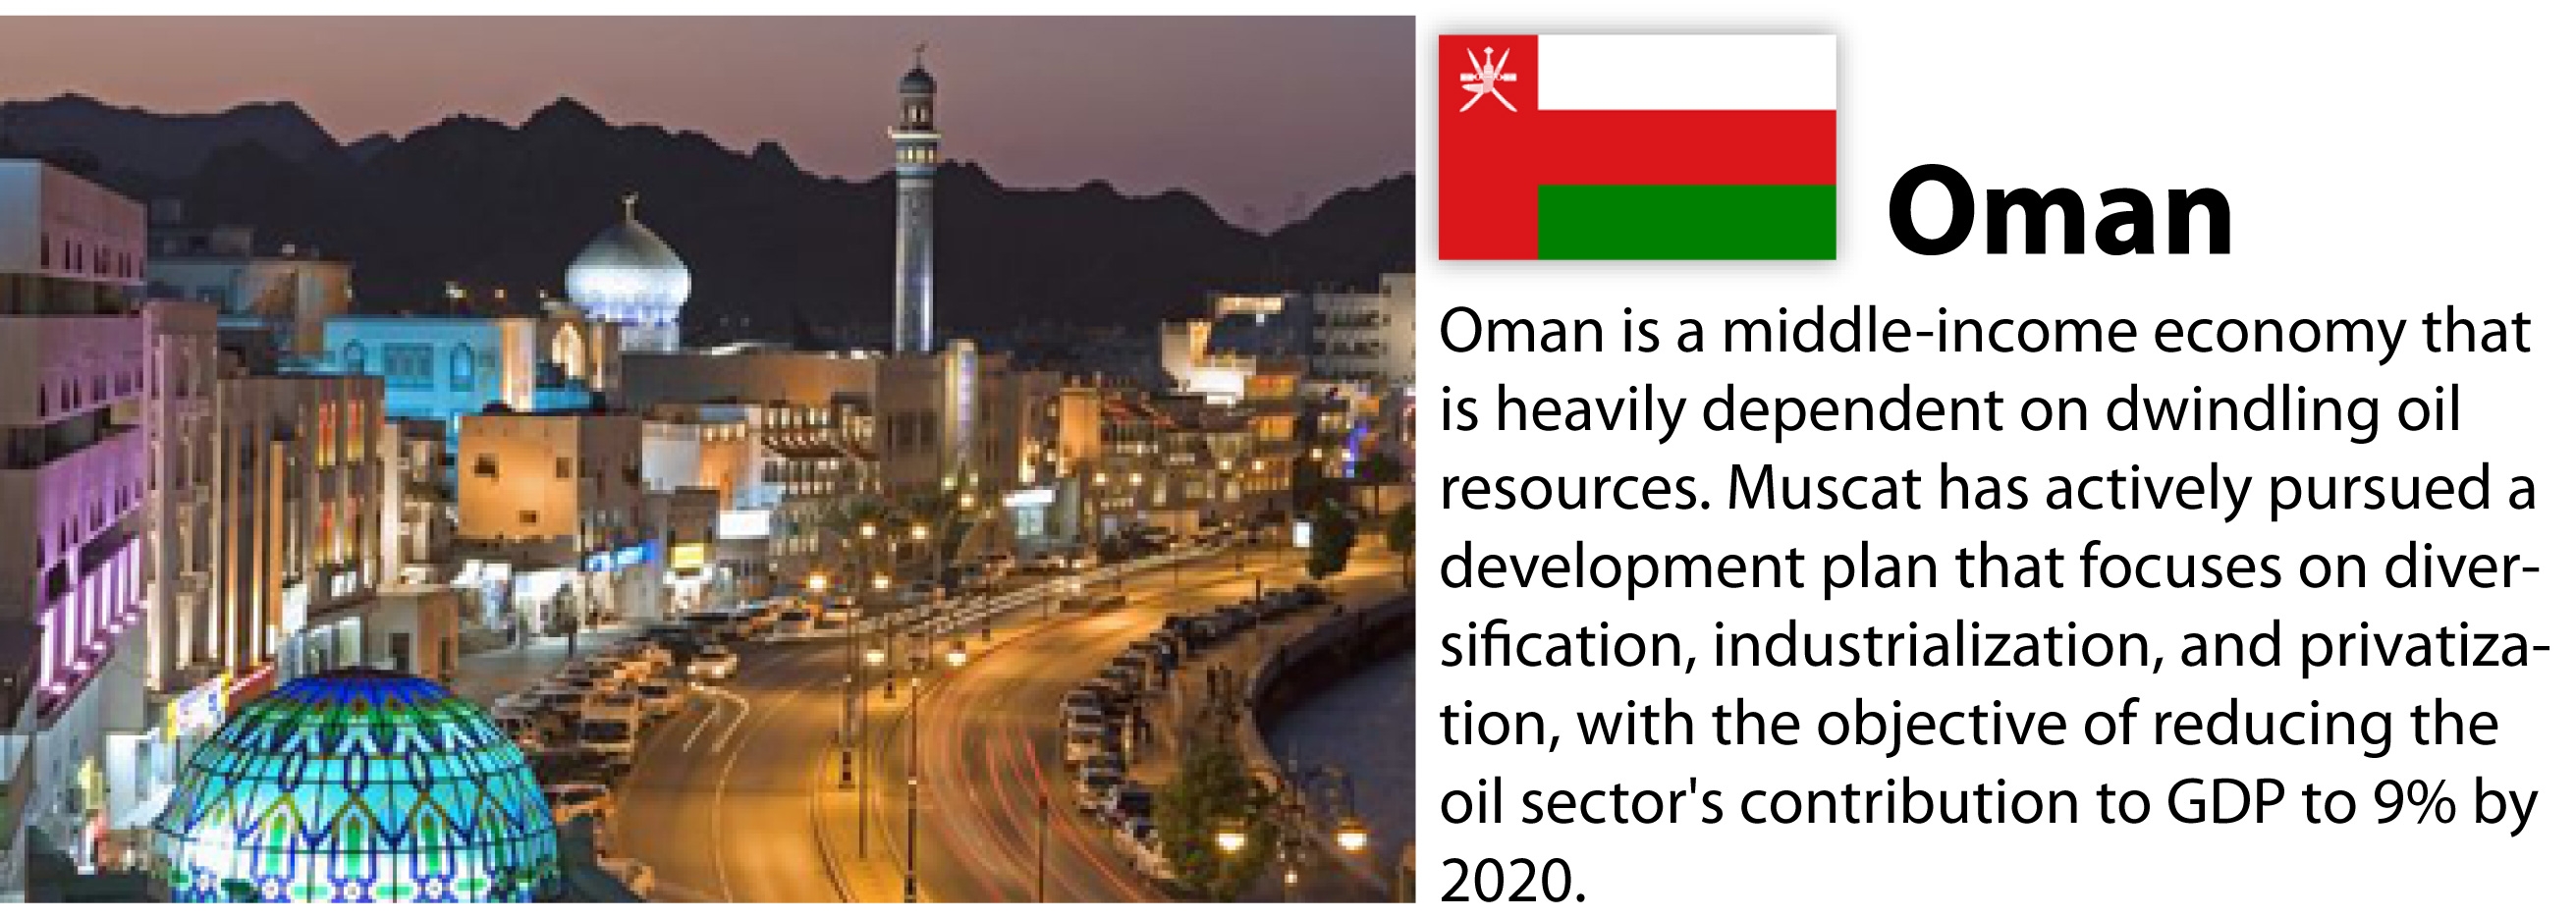
Economy of Oman Oman is a middle-income economy that is heavily dependent on dwindling oil resources. Because of declining reserves, Muscat has actively pursued a development plan that focuses on diversification, industrialization, and privatization, with the objective of reducing the oil sector's contribution to GDP to 9% by 2020. Tourism and gas-based industries are key components of the government's diversification strategy. By using enhanced oil recovery techniques, Oman succeeded in increasing oil production, giving the country more time to diversify, and the increase in global oil prices throughout 2010 and 2011 provides the government greater financial resources to invest in non-oil sectors. In the same time, Oman lies on a strategic Strait of Hormuz, where 40 percent of the world's oil shipments pass. Since 1970 the average per capita income has increased more than 5,000 per cent from $343 to reach $18,000 in 2009 and literacy rates have soared. But the question now is whether Oman can keep the momentum going. The achievements of the past 40 years have been made possible by vast revenues from oil production. However, increases in social welfare benefits, particularly since the Arab Spring, will challenge the government's ability to effectively balance its budget if oil revenues decline. By using enhanced oil recovery techniques, Oman succeeded in increasing oil production, giving the country more time to diversify. Oman has successfully executed its diversification strategy as non-oil GDP to grow 5.4 per cent in 2011 from 3.1 per cent in 2009. The non-oil sector's contribution to GDP rose considerably from 52.7 per cent in 2001 to 72.2 per cent in 2011. Factors such as high domestic demand, an expansionary fiscal policy and growth in the non-oil economy would bolster economic growth to average 5.1 per cent over 2013–17. Oman Vision 2020 Created in Muscat, the Vision 2020 of Oman was adopted in June 1995. Vision 2020 focuses on all of the aspects of the Oman economy ranging from human resources to economic diversification. As per the Vision 2020, Oman is expected to be a non-oil dependent country as it increases the measures of diversification into the services, industrial and financial sectors. Due to the fact that Oman is highly dependent on hydrocarbon for its revenues and growth. Oil’s share of total GDP is expected to drop to 9% in 2020 as compared to 41% in 2009. Oman focus on industrial sector is evident in the Vision 2020 as it plans to increase its share in GDP to 29% in 2020 as compared to 18.5% in 2009. Natural Gas is expected to see further development in production and exploration as Oman expects its contribution to GDP to reach 10% which is higher than the oil contribution. Oman is expected to carry out a third liquefied natural gas (LNG) train raising its capacity to 10mtpa of LNG. LNG is expected to become the largest non oil earner in the Omani economy and is expected to generate USD24bn over the next 25 years. Non-oil contribution to GDP is expected to reach 81% in 2020 as compared to 61.3% enjoyed in 2009. Agriculture & fishing on the other hand is estimated to contribute more than 5% in 2020 through tax incentives to corporation on income for 5 years. Paired with this is the carefully structured tourism strategy, aimed at high net worth individuals. One of the main goals of the Tourism Ministry is to represent Oman as a year-round destination.
Essential Information Area: 312,500 sq km Education
Non-sponsored business or tourist visitors can obtain two-week visas from consulates and embassies abroad. Some five days are required to process an application.
|
|


 Current local time


Basic Economic Indicators
Oman: Economic and International trade indicators {arimodule id="710" comment="Oman: Economic indicators"}{/arimodule}Source: IMF, CIA factbook.
{mprestriction ids="1,2,3"}
Economic growth
Oman: Real GDP growth (oil and Non-oil growth) {arimodule id="711" comment="Oman: Real GDP growth (oil and non-oil growth) "}{/arimodule}Source: IMF
Oman: GDP growth (Historical data) {arimodule id="712" comment="Oman GDP Growth 1980-2017"}{/arimodule}Source: IMF
Size of the economy: GDP ($ Billion) {arimodule id="713" comment="Oman: GDP, current prices ($ Billions)"}{/arimodule}Source: IMF Source: IMF
Oman: Gross Domestic Product by economic activity 2010 {arimodule id="714" comment="Oman: GDP by kind of economic activity"}{/arimodule}Source: IMF
Oman: Current account balance ($ Billions) {arimodule id="715" comment="Oman Current Account Balance"}{/arimodule}Source: IMF
Oman: Total Government Debt (% GDP) {arimodule id="716" comment="Oman Total Govt. Debt (% of GDP)"}{/arimodule}Source: IMF
Ease of Doing Business Rank 2015 {arimodule id="590" comment="Ease of Doing Business Rank 2015"}{/arimodule} Source: World Bank
Foreign Trade and Foreign Investment
Oman: Total exports and imports ($ billion) {arimodule id="717" comment="Oman: Exports and Imports ($ billion)"}{/arimodule}Source: IMF
Oman: Foreign Direct Investment (FDI) {arimodule id="718" comment="Oman FDI ($ million)"}{/arimodule}Source: UNCTAD
Oman Vision 2020: Structure of GDP (%) {arimodule id="721" comment="Oman Vision 2020 Structure of GDP"}{/arimodule}Source: IMF
Energy Sector
Oil Reserves by country 2015 (Trillion Cubic Feet)
{arimodule id="603" comment="Oil Reserves 2015"}{/arimodule}
Source: EIA
Gas Reserves by country 2015 (Billion Barrels)
{arimodule id="602" comment="Gas Reserves 2015"}{/arimodule}
Source: EIA
Oil Price
Crude Oil Export Price (US$/bbl)
{arimodule id="599" comment="Crude Oil Export Price 2012-2019 "}{/arimodule} Source: IMF
Oman: Oil supply and Exports (Thousand Barrels Per Day) {arimodule id="719" comment="Total Oil Supply and Total Exports"}{/arimodule}Source: IMF
Oman: Dry Natural Gas Production (Billion Cubic Feet) Source: IMF
Oman: Oil Exports by Destination 2013 {arimodule id="720" comment="Oman: Oil by destination "}{/arimodule}Source: EIA
Trade between Switzerland and Kuwait
Swiss total Exports to the Arab World by Country 2014: Swiss Francs
{arimodule id="301" comment="Swiss total exports to the Arab world 2014, by country: Swiss Francs"}{/arimodule}
Source of data: Swiss customs
Swiss total Exports to the Arab World 2014: (Portion of total exports)
{arimodule id="300" comment="Swiss total exports to the Arab world 2014: Swiss Francs"}{/arimodule}
Source of data: Swiss customs
Swiss Total Imports from the Arab world by country 2014: Swiss francs
{arimodule id="292" comment="Swiss Imports from the Arab world 2014"}{/arimodule}
Source: Swiss customs
Swiss Total Imports from the Arab world 2014 (Portion of the total imports)
{arimodule id="302" comment="Swiss Total Imports from the Arab world 2014 (Portion)"}{/arimodule}
Source: Swiss customs
Swiss exports/imports with the Arab world (Million CHF)
{arimodule id="516" comment="Swiss main exports, imports with the Arab world 2014 (Million CHF)"}{/arimodule}
Source: Swiss customs
Swiss main exports/imports with the Gulf region (Million CHF)
{arimodule id="540" comment="Swiss main exports/imports with Gulf Region 1984-2014"}{/arimodule} Source: calculations based on Swiss customs data
Gulf region (Bahrain, Kuwait, Oman, Qatar, Saudi Arabia, UAE)
Swiss main exports/imports with Oman (Million CHF)
{arimodule id="531" comment="Swiss main exports/imports with Oman 2007-2014"}{/arimodule}
Swiss main exports to the Arab world 2014 (CHF)
{arimodule id="544" comment="Swiss main exports to the Arab world 2014 (CHF)"}{/arimodule}
Swiss main Imports from the Arab world 2014
{arimodule id="545" comment="Swiss main imports from the Arab world 2014 (CHF)"}{/arimodule} Source: Swiss customs
Swiss main exports to Oman 2014 (Million CHF)
{arimodule id="570" comment="Swiss main exports to Oman 2014 (CHF)"}{/arimodule}
Swiss main imports from Oman 2014 (Million CHF)
{arimodule id="571" comment="Swiss main imports from Oman 2014 (CHF)"}{/arimodule}
{/mprestriction}
Swiss Exports to the Arab world by commodity comparaisons between the Arab countries

Swiss Imports from the Arab world by commodity comparaisons between the Arab countries