Funding MENA Startups – H1 2026: Structural Reconfiguration and an Analytical Shift Toward Defensive Capital
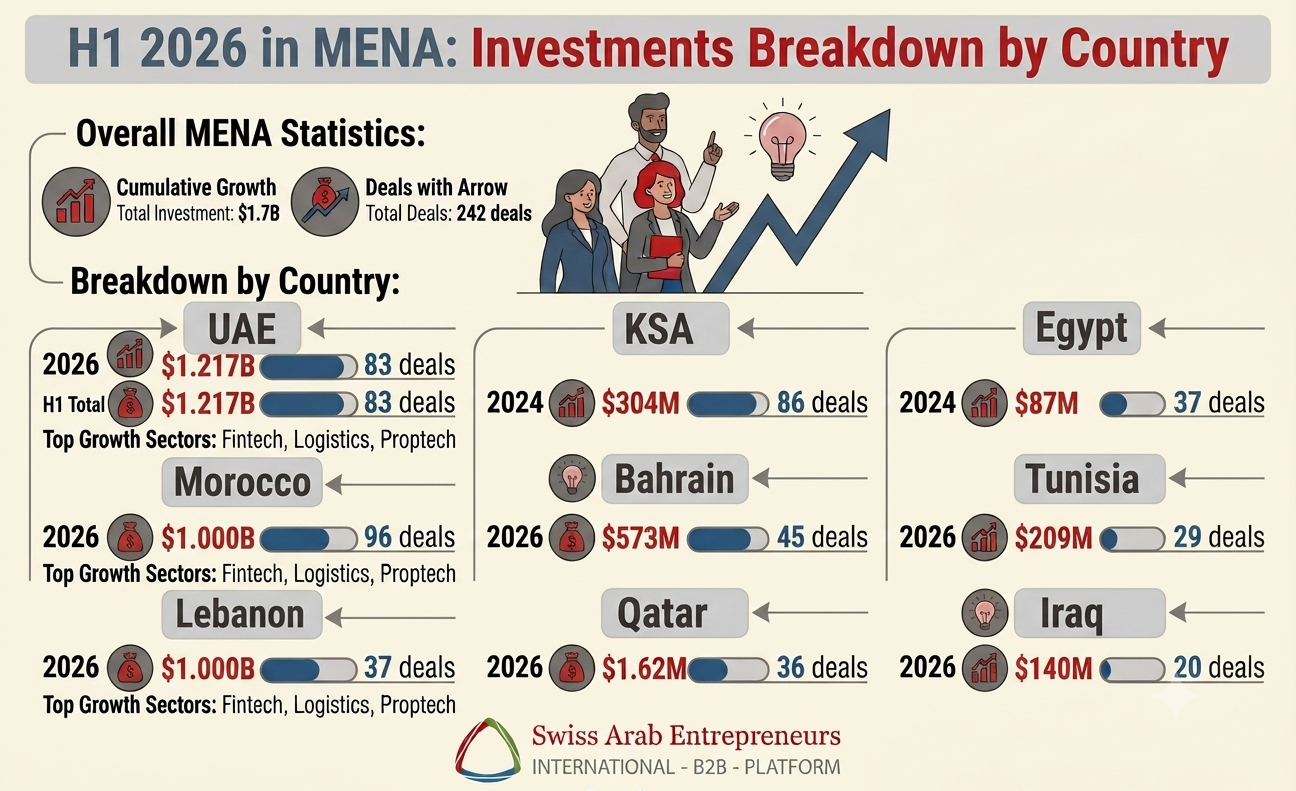
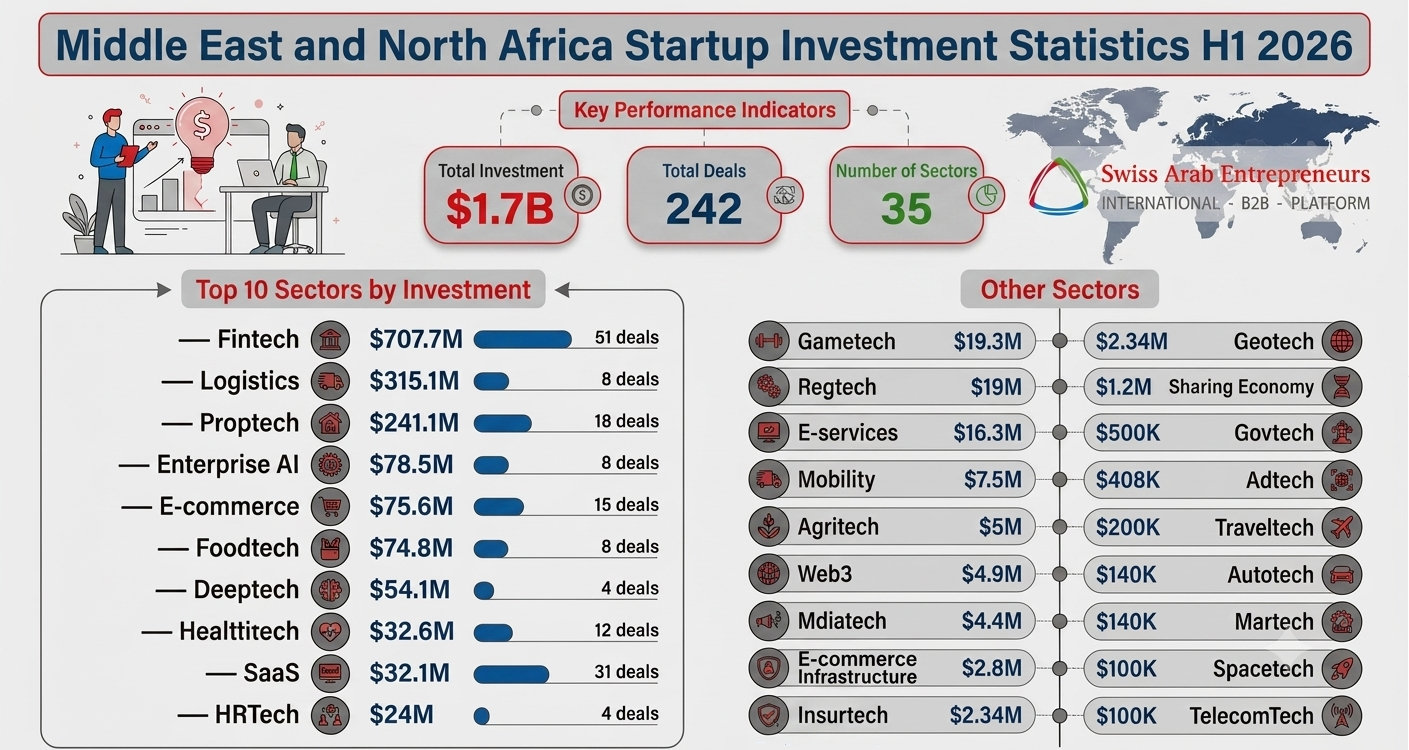
The Middle East and North Africa startup ecosystem concluded the first half of 2026 with a total funding outcome of $1.7 billion distributed across 242 deals including 35 investment sectors.
Looking at these results within the temporal and cumulative context of venture capital markets in the region since 2024, it becomes clear that the investment landscape is undergoing a deep restructuring reflected in an 18% decline in total liquidity compared to the first half of 2025 (which recorded $2.1 billion), and a steeper decline in deal intensity of 28%.
This divergence between the moderate drop in financial volume and the larger contraction in the number of transactions does not express a capital withdrawal so much as it embodies a fundamental change in investor and fund behavior; as the ecosystem transitioned from an open expansion pattern to a strategy of capital concentration and tight selectivity.
This dynamic is attributed to the intersection of direct geopolitical tensions, disruptions in maritime corridors and regional trade movement, with the seasonal impact of the slowdown in administrative transactions during the month of Ramadan and Eid al-Fitr, which prompted investment institutions to raise risk management standards and direct flows exclusively toward entities most capable of achieving operational efficiency and immediate profitability.
The Path of the First and Second Quarters: From Geopolitical Shock to Disciplined Readjustment
The chronological tracking of the months of the first half revealed successive shifts in liquidity injection mechanisms; as the first quarter of 2026 recorded total funding of $941 million through a strong start in January with about $500 million distributed across 59 deals, before flows slowed down in February to $326.6 million as a result of escalating field risks, reaching near-forced contraction in March with funding that did not exceed $48.3 million across 17 deals, recording its lowest historical levels.
In the second quarter, total investments reached $793.5 million distributed across 104 deals, achieving a 16% decline in funding value and 25% in the number of deals compared to the first quarter.
Although the second quarter recorded a lower financial volume than the first quarter, it reflected a state of procedural stability compared to the sharp drop witnessed in March; as funds resumed their activity by executing larger funding rounds but within a narrower circle of companies, confirming that the market entered a "re-calibration" phase and selected huge funding tickets for a specific number of defensive projects instead of distributing liquidity over a wide fabric of early-stage companies.
Geographic Distribution and Comparative Analysis (2024 - 2026): Shift in Financial Centers of Gravity
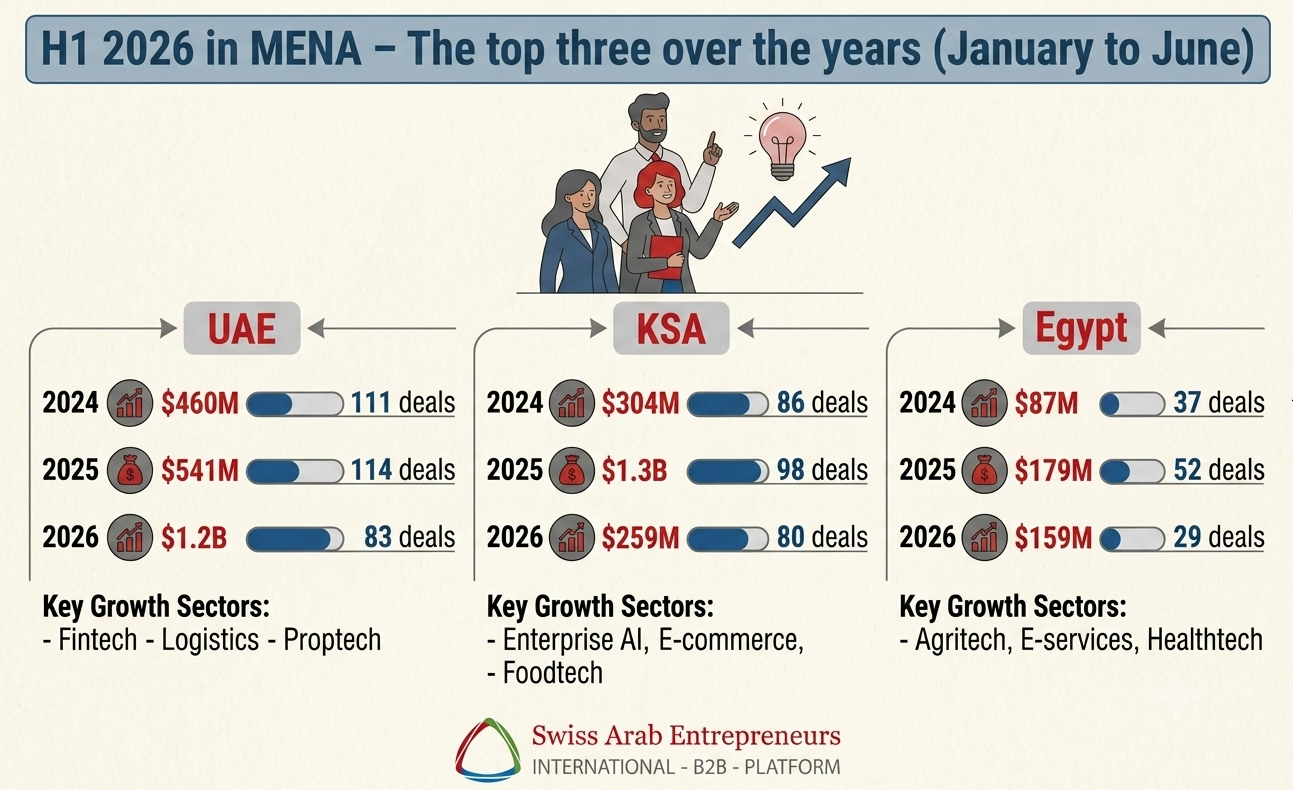
Geographic distribution data for the first half of 2026 revealed a strategic shift in the distribution of liquidity among primary markets when compared to the last three years; as the United Arab Emirates achieved a record leap by raising $1.217 billion across 83 deals, capturing alone more than 71.5% of total regional funding with an exceptional year-on-year growth rate of 125% compared to the first half of 2025 ($541 million across 114 deals) and the first half of 2024 ($460 million across 111 deals), with the average deal value rising to $14.6 million to confirm its transformation into a center of gravity that absorbs advanced and large rounds during crises.
In contrast, the Kingdom of Saudi Arabia witnessed a tactical reset following the peak of 2025 by raising $259 million distributed across 80 deals, a decrease of 80% compared to the first half of 2025 ($1.3 billion across 98 deals) and compared to $304 million across 86 deals in 2024, and this decline is mainly due to the absence of major debt funding rounds and the postponement of investment exhibitions at the beginning of the year while activity continued in the early stages.
For its part, Egypt showed resilience in the face of economic pressures by raising $158.9 million across 29 deals, a slight decline of 11% compared to the first half of 2025 ($179 million across 52 deals) and a significant rise from the first half of 2024 ($87 million across 37 deals), reflecting capital concentration in operationally proven entities.
The rest of the flows were distributed at varying levels among regional and promising markets; as Morocco ranked fourth with $29.4 million across 8 deals, followed by Bahrain with $25.1 million across 3 deals, the Sultanate of Oman with $20.8 million across 15 deals, and Qatar with $15.4 million across 10 deals, down to limited flows in Jordan ($5.4 million across 3 deals), Lebanon ($3 million across 1 deal), Tunisia ($300 thousand across 3 deals), and Iraq ($200 thousand across 2 deals).
In this context, Syria emerged as a milestone in regional funding shifts; alongside early seed rounds that recorded $550 thousand across 5 deals, the scene witnessed a strategic turning point with the comprehensive application Labby (Super App) breaking the funding barrier by raising $10 million from an Emirati-Saudi investment alliance as the first foreign direct investment in the Syrian tech sector, indicating the start of Gulf liquidity inflows to support digital infrastructure platforms and seize recovery opportunities in promising markets.
Sectoral Breakdown of Liquidity: Lead of Structural Sectors and Enterprise AI
The numerical breakdown of liquidity in the first half of 2026 reveals intense capital concentration in structural and execution-heavy sectors; as the top three sectors captured more than 74% of total regional investments, establishing the doctrine of conservatism and bias toward hard infrastructure.
Financial technology (Fintech) led the scene as the backbone of the digital economy by attracting $707.7 million across 51 deals (with an average of $13.87 million per deal), while the logistics sector reflected the highest levels of investment appetite to hedge against disruptions in supply chains and regional navigation by raising $315.1 million across only 8 deals, recording the highest average deal ever at $39.38 million.
Real estate technology (Proptech) came third with $241.1 million across 18 deals benefiting from Gulf real estate momentum.
Regarding the shift of liquidity toward complex tech assets with direct intellectual property, Enterprise Artificial Intelligence (Enterprise AI) emerged with $78.5 million across 8 deals (with an average of $9.81 million), and Deep Technology (Deeptech) with $54.1 million across 4 deals with a high average of $13.52 million, confirming the trend toward business automation and operational efficiency solutions.
In contrast, the Software as a Service (SaaS) sector showed a paradoxical state between deal density and low liquidity volume; as it occupied second place regionally with 31 deals, but with a total that did not exceed $32.1 million and a tiny average of $1.03 million per deal, indicating a broad base in the early stages with strict control over funding tickets and avoidance of late growth rounds.
Funding stabilized at disciplined levels in direct consumer sectors such as e-commerce ($75.6 million across 15 deals), food technology ($74.8 million across 8 deals), health technology ($32.6 million across 12 deals), and human resources technology ($24 million across 4 deals), reflecting a shift in the valuation of these sectors toward sustainable profitability instead of aggressive expansion.
In early stages and specialized sectors, liquidity was distributed over a wide list; as gaming technology (Gametech) raised $19.3 million across 24 deals, regulatory technology (Regtech) $19 million across 6 deals, and e-services $16.3 million across 4 deals. Other fields also recorded scattered flows including transportation and mobility ($7.5 million, 4 deals), agricultural technology ($5.7 million, 5 deals), Web3 technology ($5 million, 1 deal), media technology ($4.9 million, 5 deals), cybersecurity ($4.4 million, 2 deals), insurance technology ($2.9 million, 3 deals), educational technology ($2.8 million, 4 deals), and e-commerce infrastructure ($2.4 million, 4 deals).
As for the last segment of markets, it witnessed ultra-micro volumes; as construction technology (Contech) recorded $2.34 million (6 deals), climate technology (ClimateTech) $2 million (1 deal), geographic technology (Geotech) $1.3 million (1 deal), sharing economy $1.2 million (1 deal), biotechnology (Biotech) $500 thousand (1 deal), government technology (Govtech) $408 thousand (1 deal), sports technology $266 thousand (1 deal), advertising technology (Adtech) $200 thousand (1 deal), and each of clean technology (Cleantech) and travel technology (Traveltech) $140 thousand each across two deals, down to symbolic funding worth $100 thousand in a single deal in automotive technology (Autotech), marketing (Martech), space technology (Spacetech), and telecommunications (TelecomTech).
Investment Stages and Funding Instruments: Contraction of Expansion Rounds and a Shift in Debt
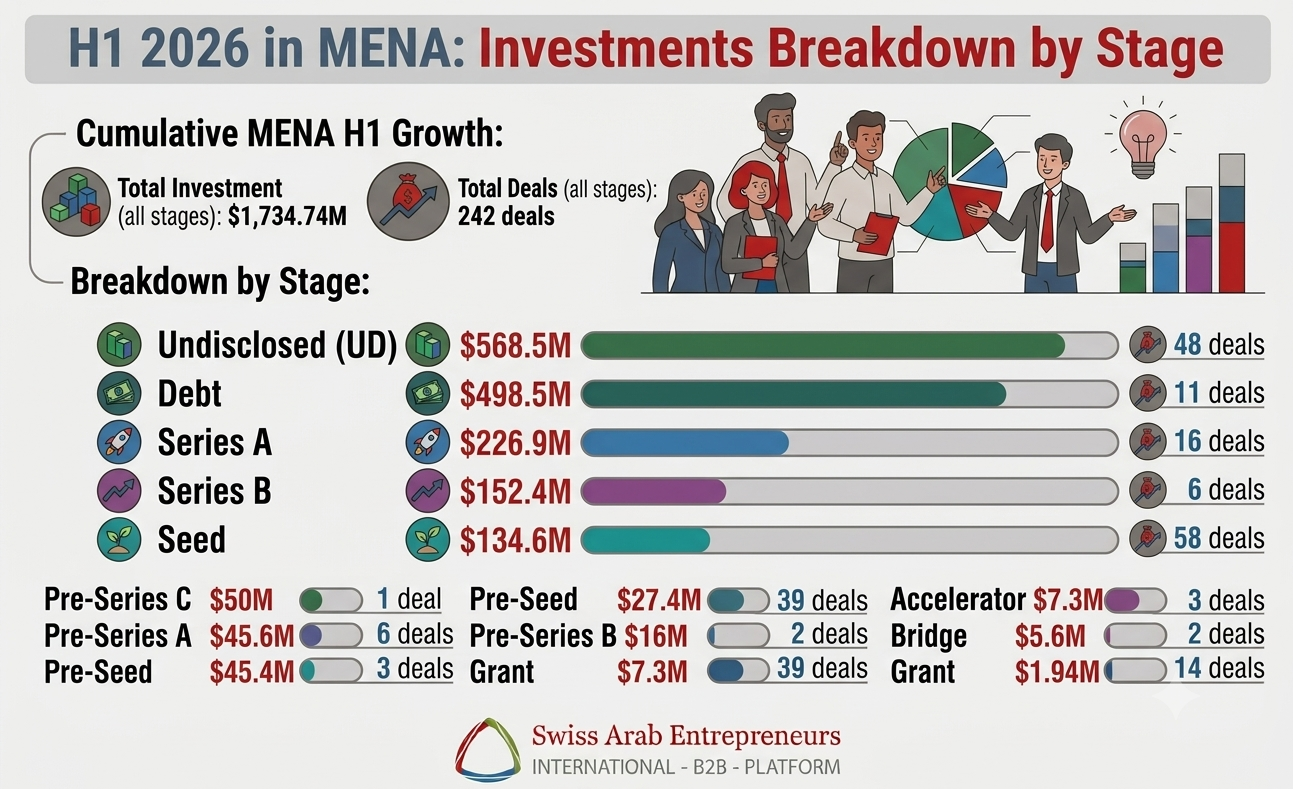
The structural distribution of liquidity by investment stages and funding instruments during the first half of 2026 revealed an analytical shift reflecting an increased hedging behavior and an imbalance in the risk pattern; as Undisclosed rounds topped the financial scene by raising $568.5 million across 48 deals, in an explicit indication of the tendency of investment entities and companies toward secrecy and discretion over their valuations amid current geopolitical environment pressures.
Regarding funding instruments, Debt Financing witnessed a remarkable decline to reach $498.5 million across only 11 deals, constituting about 29.3% of total regional liquidity compared to 44% in the first half of 2025, which is analyzed by the funds' gradual dispensing with high-cost debt instruments and moving toward injecting direct equity investments (Equity).
In the equity map, direct funding concentrated in Series A rounds with $226.9 million (16 deals), and Series B rounds with $152.4 million (6 deals), while the Seed stage maintained the highest density in the number of deals at 58 deals raising $134.6 million to confirm the continued vitality of the initial base of the ecosystem.
The picture was completed by intensive reliance on transitional bridge rounds to bridge and avoid negative revaluation; as the Pre-Series C round recorded funding of $50 million (1 deal), Pre-Series A rounds about $45.6 million (6 deals), Pre-Seed rounds about $27.4 million (39 deals), and Pre-Series B worth $16 million (2 deals).
This coincided with business accelerator activity at $7.3 million (39 deals), Bridge rounds at $5.6 million (2 deals), and Grants at $1.94 million (14 deals); proving the funds' strategy in postponing late growth rounds and directing liquidity toward maintaining the operational flow of existing entities and nourishing early stages.
These numbers clarify that funding in the first half of 2026 concentrated entirely in two sectors: major deals of a special nature or institutional debt, and abundant rounds in foundational and early stages (Seed, Pre-Seed, and accelerators), with almost complete paralysis in late growth rounds (Growth/Late Stage) which funds avoided until macroeconomic clarity emerges.
Business Models and Strategic Activity: Outperformance of Capital Efficiency and Rise of Acquisitions
Distributions by business models confirmed continued bias toward models capable of generating predictable financial flows; as business-oriented companies (B2B) succeeded in raising $763.5 million across 140 deals, ahead of consumer-oriented companies (B2C) which harvested $748 million across a smaller number of deals.
In light of the difficulty of closing advanced funding rounds in equity markets, the regional ecosystem turned toward the option of mergers and acquisitions (M&A) as a strategic path to maintain growth and provide safe exits; as the first half witnessed prominent acquisition deals such as Converted's acquisition of the Mitcha platform to expand e-commerce services, Yassir's expansion through the acquisition of the advertising platform Kawarizmi, and Qualiphi's acquisition of Career Club.
These moves prove that companies possessing prior solvency took advantage of the low valuation period to expand horizontally and acquire existing entities possessing a customer base and a stable operational structure.
Future Indicators
The first half of 2026 presents a picture of an investment ecosystem reformulating its conditions; the recorded decline in total liquidity and deal density does not reflect a decline in the region's attractiveness as much as it indicates a shift in investment doctrine from "growth at any cost" to "financial discipline and operational efficiency."
The data proved that capital is still available and retaining its funding in funds, but it has come to operate with more conservative mechanisms; as it concentrates in environments with higher regulatory flexibility (UAE), sectors of a defensive nature (Fintech, Logistics, Proptech, Enterprise AI), and business models based on institutional contracts.
Moving into the second half of the year, this selective approach is expected to remain dominant, awaiting the completion of postponed rounds once geopolitical factors stabilize and field pressures clear from the region's economic corridors.